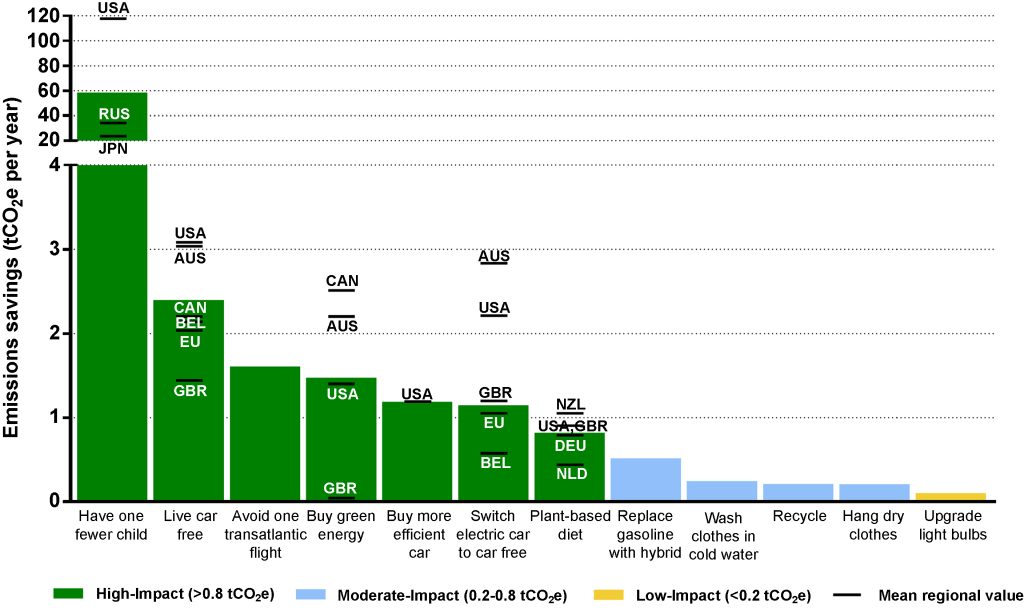
A comparison of the emissions reductions from various individual actions. The height of the bar represents the mean of all studies identified in developed nations, while black lines indicate mean values for selected countries or regions (identified by ISO codes) where data were available from specific studies. Actions are classified as high (green), moderate (blue), and low (yellow) impact in terms of greenhouse gas emissions reductions. Note the break in the y-axis for the first bar.
Source: The Climate Mitigation Gap: Education and Government Recommendations Miss the Most Effective Individual Actions by Seth Wynes and Kimberly A Nicholas